
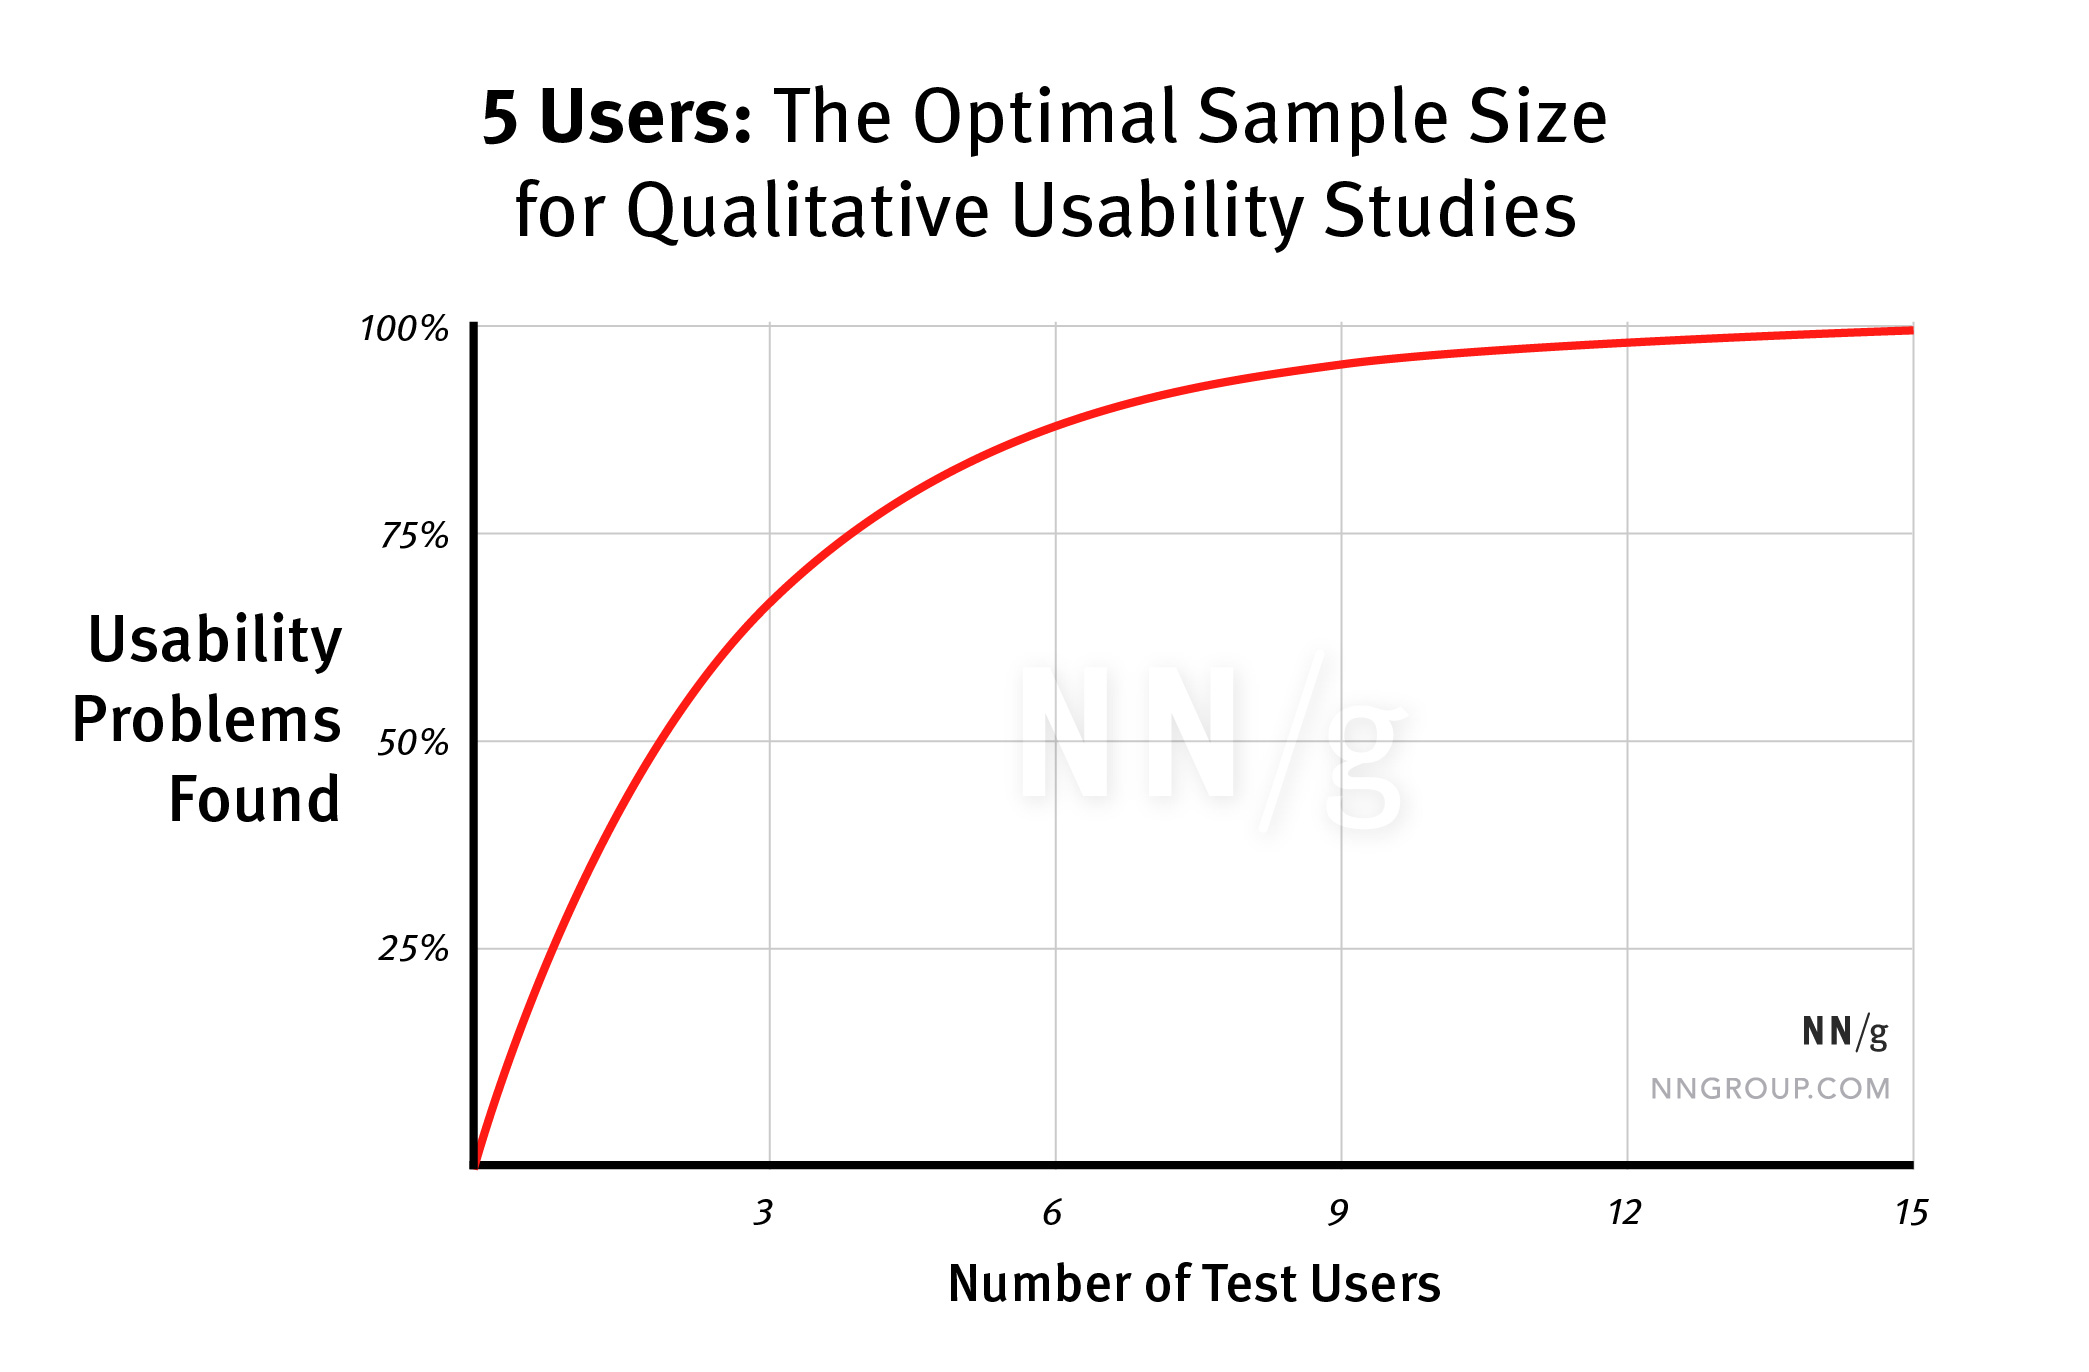
We've all seen Jacob Nielsen's chart on the suggested number of users for rapid usability insights. It shows that with 5–8 participants, you'll find more than 85% of usability problems. But this is a widely misunderstood finding — and the misunderstanding has real consequences for how researchers scope studies.
Starting at 28:00 in a talk by Jeff Sauro, PhD — quant researcher and author of Quantifying The User Experience — he breaks down the math that's actually embedded in the original NN/g article from 2000.
The formula
The typical value of L used in Nielsen's chart is 31%, averaged across a large number of projects NN/g studied. And here's where the nuance lives.
What the chart actually shows: with 5–8 participants, you have an 85% chance of seeing usability issues that affect roughly 1 out of 3 of your users — not 85% of all usability problems in general.
Said another way, in Jeff Sauro's framing: "Let's say there is a problem in your software that 1 out of 3 people have. If you were to test 5 users selected from that group, you're gonna have an 85% chance of seeing that problem at least 1 time."
This means 5 users captures the biggest issues — problems that require at least 1 in 3 people to experience them. If 25%, 20%, or 10% of users experience an issue, a sample of 5 will not statistically surface that insight.
Sample size and product development stage
The key question is: what stage of development are you testing at?
Never been tested before? The probability of finding large usability issues is high. 5–8 participants should capture those (issues affecting 31–20% of users).
Already been through research, iteration, or release? The large issues are likely already fixed. The remaining problems affect a smaller proportion of users — and you'll need a larger sample to statistically surface them.
For example: if 1 out of 10 people (10%) would experience a usability issue, you need 20 participants to have an 88% chance of seeing it at least once.
Chance of detecting a problem by sample size and problem frequency
| Problem Frequency | n=3 | n=5 | n=10 | n=15 | n=20 | n=25 |
|---|---|---|---|---|---|---|
| 1% | 3% | 5% | 10% | 14% | 18% | 22% |
| 5% | 14% | 23% | 40% | 54% | 64% | 72% |
| 10% | 27% | 41% | 65% | 79% | 88% | 93% |
| 15% | 39% | 56% | 80% | 91% | 96% | 98% |
| 25% | 58% | 76% | 94% | 99% | 100% | 100% |
| 50% | 88% | 97% | 100% | 100% | 100% | 100% |
| 90% | 100% | 100% | 100% | 100% | 100% | 100% |
Chance of Detecting = 1−(1−p)ⁿ · Source: MeasuringU / Jeff Sauro
The math for mature products
The formula works in reverse too — to calculate the participants needed to detect an issue affecting 20% of users with 85% confidence:
Via Jeff Sauro, based on 7 consumer software studies that were out of the design phase: he found an average p value of 0.23. Running that through the formula:
Log(1−.95) / Log(1−.23) = 11.4 → 11–12 participants
For more granular issues affecting 10% of users at 88% confidence: 20 participants.
Iterative research across design sprints
For products going through repeated testing with design sprints in between, you can distribute participants across iterations — each study is additive toward your cumulative target.
Example: To find 90% of problems affecting 15% of the population (requiring 14 total participants), across 3 design sprints:
Surface largest issues
Cumulative: 7
Cumulative: 14 ✓
Important constraint: for iterative accumulation to work, you need to control for variation in study design — test with the same tasks and the same level of prototype fidelity between iterations. The math assumes you're measuring the same thing across sessions.
The math is not controversial. The value of p is.
Research from Virzi 1990, Nielsen & Landauer 1993, Lewis 1994, and Spool & Schroeder 2001 all use the same formula — but find very different values of p (ranging from 0.029 to 0.41). High agreement on the formula; significant disagreement on the probability of occurrence.
The practical question Jeff Sauro poses: "Is 31% the right number to use, and is it always the right number to use?" — is the real methodological question every researcher should be asking before they scope a study.
Final takeaways
- Seeing a usability issue once is enough. In usability research, a single observation is statistically meaningful — it does not need to appear multiple times to be valid.
- Match sample size to product maturity. Early-stage products with no prior testing: 5–8 participants is often sufficient. Iteratively developed or released products: plan for 12–20+ depending on your confidence threshold and problem frequency target.
- Know your p. The 31% L value is an average. If your product has already been through multiple rounds of testing, your remaining issues likely have a lower probability of occurrence — and your sample size calculation should reflect that.
Further reading: Jeff Sauro — Quantifying The User Experience (2012)